Unlike PlayStation 5 and Xbox Series consoles, personal computers allow for very fine adjustments to game graphics. For this, you need to know the approximate power of the components and the frame rate that PC components can provide. Today, we will tell you how to enable performance monitoring in games to find out the power of components and learn how to properly set graphic settings.

Step 1 - Installing MSI Afterburner
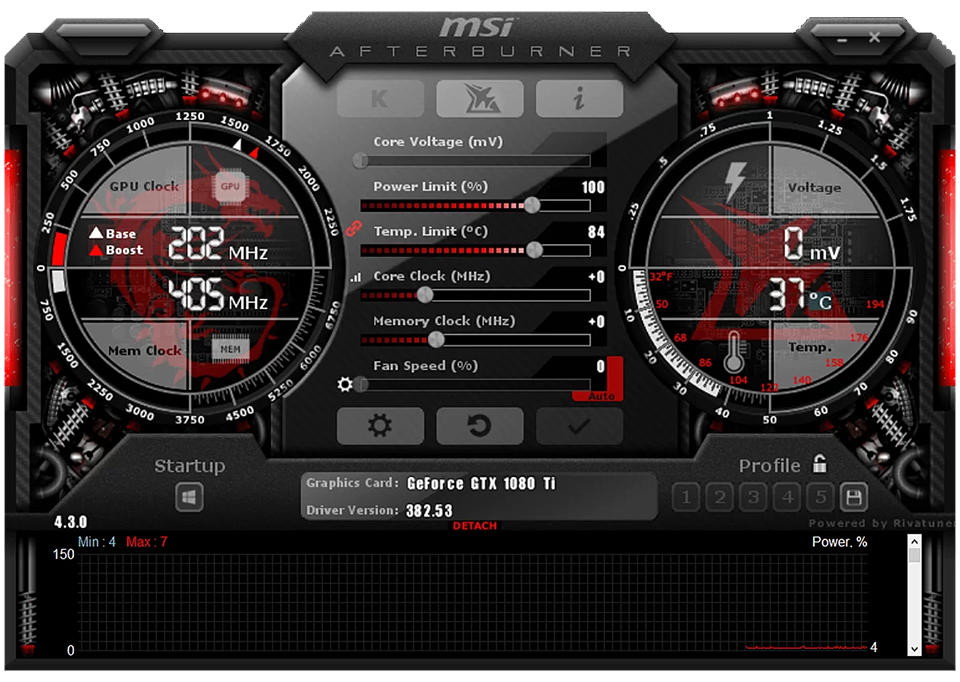
MSI Afterburner is a monitoring program that displays many useful information for analyzing computer performance, including the frame rate in the game. The application is completely free and can be downloaded from MSI's official website.
If for some reason you don't like MSI Afterburner, you can install any other monitoring utility. For example, FPS Monitor, MangoHUD, NZXT CAM, or Fraps. However, we will only use the program from MSI. It is a very popular application with a rich set of features. It shows not only the frame rate but also a lot of other useful information, such as load percentage, temperatures of the CPU and GPU, the amount of used RAM, and so on.
Go to the official MSI website, download the application archive, unpack it, and run the installation file. Simply press "Next" and install Afterburner like any other program. At the end, a window will appear with a suggestion to install the RivaTuner utility. Be sure to agree. RivaTuner will display monitoring data on the screen right during gameplay. So, we won't have to minimize the game.

Step 2 - Configuring MSI Afterburner
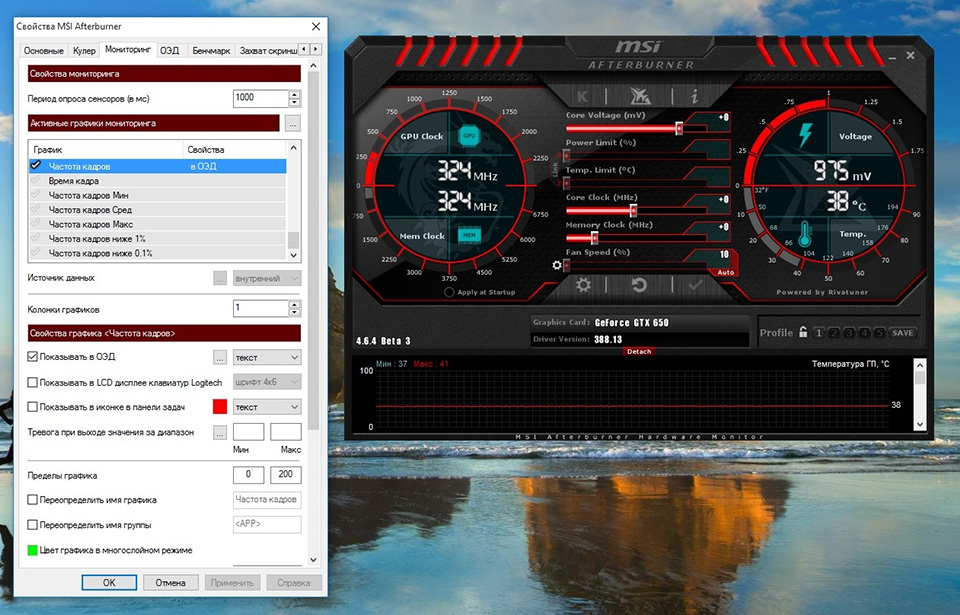
After finishing the installation, open MSI Afterburner and click on the "gear" icon to enter the program's settings.
Next, go to the "Monitoring" tab and pay attention to the "Active hardware monitoring graphs" window. Here are listed the main parameters that MSI Afterburner displays. Check the following items:
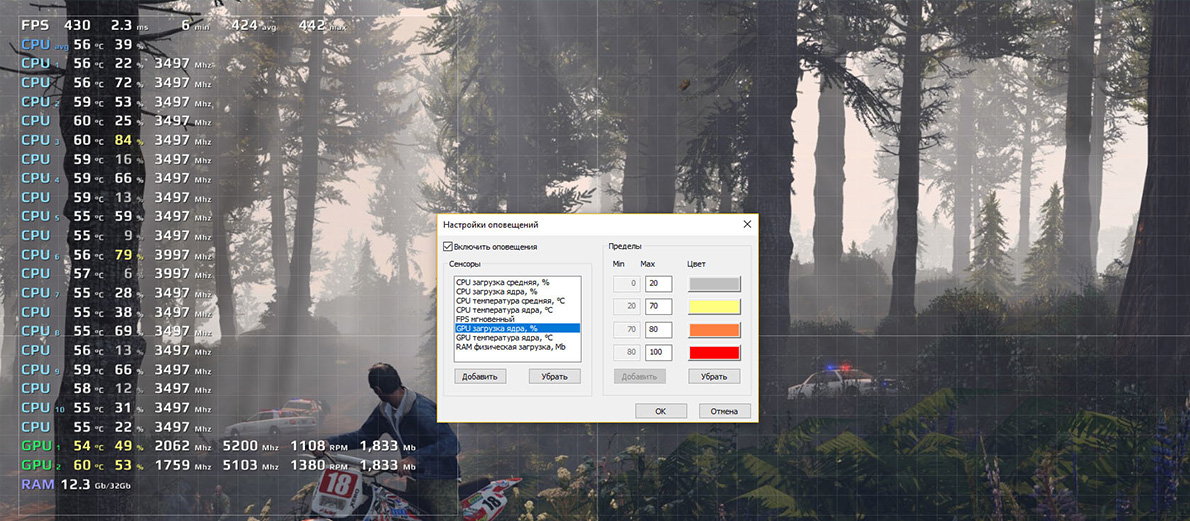
- GPU Temperature. Shows the current temperature of the GPU. It will be displayed in the GPU line with the "°C" symbol.
- GPU Usage. Shows how much the GPU is being utilized in percentage. It will be displayed in the GPU line with the "%" symbol.
- Memory Usage. Shows how much video memory is being used. It will be displayed in the MEM line with the "Mb" notation.
- CPU Temperature. Shows the average temperature of all CPU cores. It will be displayed in the CPU line with the "°C" symbol.
- CPU Usage. Shows how much the CPU cores are being utilized in percentage. It will be displayed in the CPU line with the "%" symbol.
- RAM Usage. Shows how much RAM is being used. It will be displayed in the RAM line next to the "Mb" notation.
- Frame Rate. Shows the FPS in the game. Depending on the used API, it will be displayed as "D3D11", "D3D12", "VLK", "OGL", and so on.
Select the listed parameters by holding down the "Ctrl" key and clicking the left mouse button on each item. Then check the box next to the "Show in On-Screen Display" parameter. Click "OK" and the settings will be saved.
That's it for configuring MSI Afterburner. When you start the game, you will see the parameters you set in the program in the top left corner. For analyzing the power of components and FPS, this will be enough.
Go to the graphic settings, change parameters, and see how performance improves or worsens. This way, you will find the best balance between picture quality and the final frame rate.
To stop monitoring the system in the game, simply close MSI Afterburner. You can also minimize the program window, and it will move to the right part of the taskbar. To display it again, press the "Hide" arrow and click on the utility.

Step 3 - Configuring RivaTuner
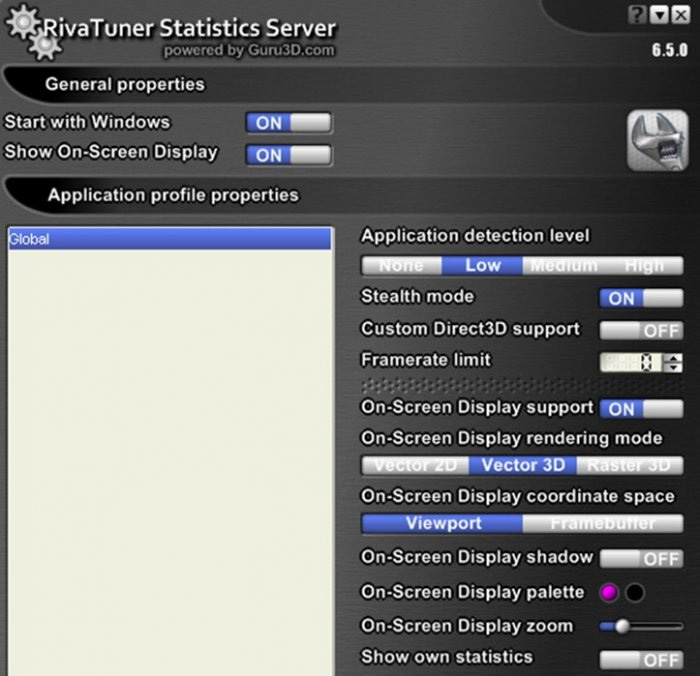
If you do not like the standard placement of monitoring parameters in games, you can change them using the RivaTuner program. This utility also allows changing the color of parameters, their font, size, position in the list, and so on.
To customize the monitoring values, open MSI Afterburner and go to settings by pressing the "gear" icon. Select the "On-Screen Display" tab and click "Advanced" at the bottom of the window. RivaTuner will open.
To increase the scale of the monitoring parameters, find the "On-Screen Display Zoom" item. Drag the slider to the right to increase the size. All changes will be displayed in a small window located at the bottom of the program.
In the same window, you can change the position of the monitoring parameters. Simply hold the number "60" and drag it to the part of the window where you want to see the monitoring values. If you enter the game, you will immediately see that the position of the parameters has changed.
RivaTuner has many other settings to play with. For example, to change the font, press the "Raster3D" item and set the appropriate values in the opened window. This way, you can individualize the system monitoring parameters in games, making it even easier to analyze PC power.
Conclusions
To set up PC resource monitoring in games, you need to:
- install MSI Afterburner and RivaTuner;
- display temperature, load, and frame rate parameters in the On-Screen Display;
- save settings and, if desired, customize monitoring parameters.
Monitoring FPS and temperatures in HYPERPC computers
All our computers are thoroughly tested in stress tests - programs that artificially load components. Engineers analyze the values of monitoring utilities and only after successfully passing all tests, the systems are sent to customers. Therefore, it is not necessary to check HYPERPC computers in monitoring applications. Unless you want to convince yourself of the PC's power to learn how to properly set graphic settings in modern games.